PSL Performance Analytics Dashboard
Interactive visualization and ETL pipeline for Pakistan Super League (2016-2024)
Management Request
Management emailed a list of tasks to be implemented.
Project Highlights
This end-to-end project features:
- Web scraping of match and player data from ESPNcricinfo and Cricbuzz.
- Data cleaning pipeline using Python and Pandas to standardize records.
- AWS MySQL RDS storage with indexed tables for fast querying.
- Streamlit dashboard displaying top batting and bowling KPIs and player analytics.
In this project, I implemented the visualization components using Python and SQL.
For the ETL pipeline, refer to View ETL Pipeline
Dashboard Features


Technical Architecture
Workflow
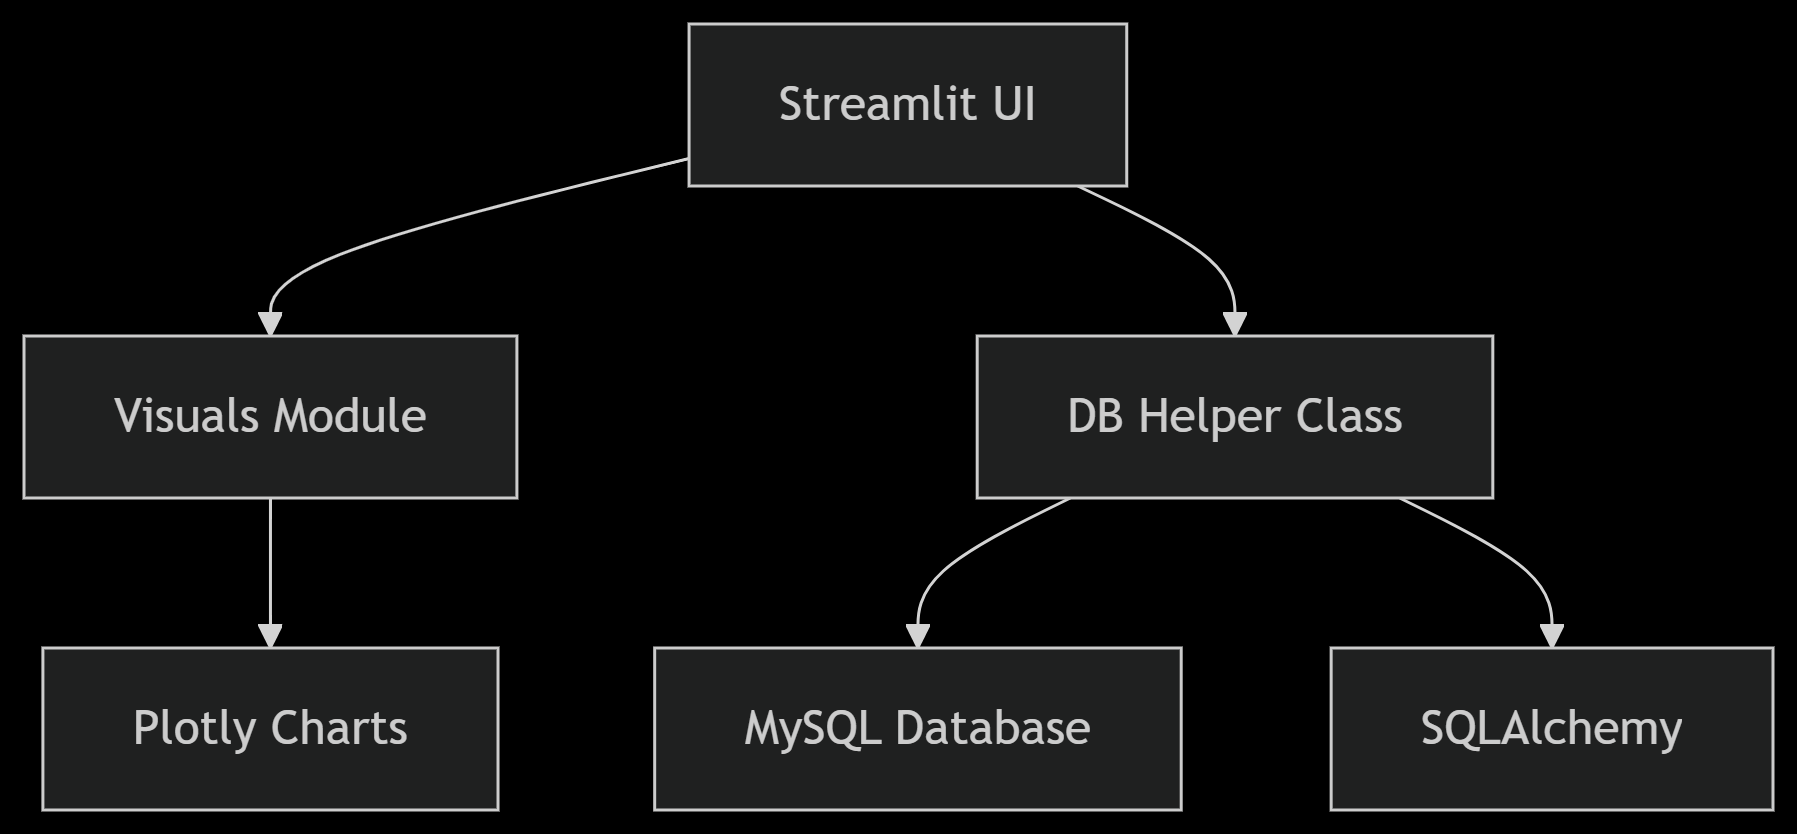
Frontend
- Streamlit
- Plotly Express
Data Processing
- MySQL
- Pandas
- SQLAlchemy for DB interactions
Database
- AWS MySQL RDS
Analytical Capabilities
| Module | Features | Metrics |
|---|---|---|
| Overall Batting | Top 10 runs, averages, strike rates, boundaries | Runs, Avg, SR, Boundaries |
| Player Batting | KPI metrics & charts: runs by season/team, dismissal breakdown | Matches, Runs, SR, Avg, Fours, Sixes, 50s, 100s |
| Overall Bowling | Top 10 wickets, avg, economy, strike rates | Wickets, Avg, Econ, SR |
| Player Bowling | KPI metrics & charts: wickets by season/team, distribution | Innings, Balls, Runs, Wickets, Avg, Econ, Strike Rate, Dot%, BBI, Bowling Average |
Key Features
- Dynamic filtering by season and player
- Dual tabs for charts and raw data
- Auto-generated KPI metrics at a glance
- Responsive layout with wide configuration
Technical Challenges Solved:
- Handled inconsistent HTML scraping across multiple sources, transformed the data and loaded the data.
- Visualization logic with Plotly for maintainability.
- SQL logic to fetch appropriate data from database